12,151 Industrial Products Across 10 Brands Account for $24.4M in Liquidated Value, Surplus Network Analysis Finds
TORONTO, ON / ACCESS Newswire / November 4, 2026 / Surplus Network has analyzed publicly displayed liquidation figures
Press Release Disclaimer: This is a press release distributed through the XPR Media network. It has not been independently verified by our newsroom.
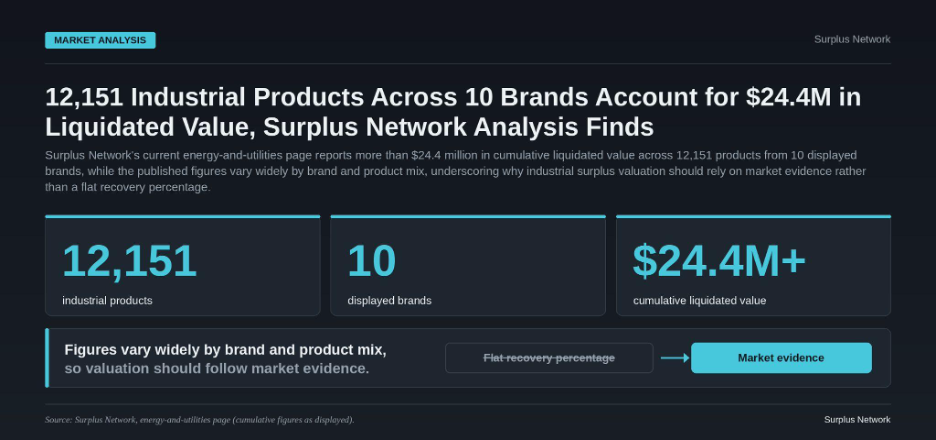

TORONTO, ON / ACCESS Newswire / November 4, 2026 / Surplus Network has analyzed publicly displayed liquidation figures from its Energy & Utilities page, revealing the scale and variation in industrial surplus valuations across major equipment brands. The page reports more than $24.4 million in cumulative liquidated value across 12,151 products from 10 displayed brands [Surplus Network, Energy & Utilities, reviewed October 2026]. The analysis underscores why businesses should base surplus inventory decisions on market evidence rather than flat recovery percentages, as product mix, condition, age, and demand significantly affect what similar assets ultimately recover.
The analysis is based on an analyst’s sum of the 10 visible brand rows currently displayed on Surplus Network’s Energy & Utilities page [Surplus Network, October 2026], where each row shows a product count, a minimum liquidated value marked as “over $X”, and a latest-valuation timestamp of September 10, 2026. The page displays valuations but does not disclose the underlying transaction records, original purchase prices, or exact timelines. Surplus Network’s Terms of Use clarify that the platform provides valuation estimates and buyer connections but does not itself facilitate the actual sale, purchase, or payment transaction.
Brand-Level Variation in Reported Liquidated Value
The 10 brands displayed on the page show substantial variation in cumulative value relative to product count, illustrating why inventory valuation requires more than a single percentage figure. Square D accounts for the largest visible position with 3,417 products and more than $5.5 million in reported liquidated value, according to Surplus Network, Energy & Utilities, September 10, 2026. General Electric follows with 1,554 products and more than $5.0 million. It further states that ABB shows 1,457 products valued at more than $3.7 million.
The source also displays that the remaining seven brands display an equally wide range. GE Fanuc accounts for 605 products and more than $2.3 million, Honeywell shows 1,528 products and more than $2.0 million, Parker displays 897 products and more than $1.5 million, GE shows 770 products and more than $1.4 million, Eaton accounts for 829 products and more than $1.3 million, Mitsubishi displays 581 products and more than $1.1 million, and Vary shows 513 products and more than $288,000.
What emerges from these rows is not a consistent relationship between product count and cumulative value. Square D’s 3,417 products generate more than $5.5 million, while GE Fanuc’s 605 products generate more than $2.3 million. Similarly, Honeywell’s 1,528 products generate more than $2.0 million, while Parker’s 897 products generate more than $1.5 million. These spread across the 10 rows demonstrates that the number of items alone does not determine recovery value.
The source of this variation cannot be attributed to the brand alone. The public rows do not disclose the specific model mix, condition, age, quantity per SKU, storage location, time-to-sale, or demand conditions for each brand’s inventory. A large product count might represent older or more commoditized equipment, while a smaller count could include high-value specialty components. Without normalized data across these variables, the variation illustrates why flat recovery percentages are unreliable valuation shortcuts.
Average Value Per Item and Its Limitations
Across the 10 brand rows, the $24.4 million cumulative value and 12,151 product count imply an average of approximately $2,009 per product [Analyst calculation, Surplus Network data, October 2026]. This arithmetic is useful as a descriptive check on the aggregate but should not be treated as a market benchmark or expected recovery figure for any individual asset or portfolio.
The calculation carries several limitations; each dollar figure on the page is displayed as “over” a specified amount, meaning the true average could be higher than $2,009. More importantly, the brands, products, and conditions represented across the 10 rows are not comparable. A motor manufacturer’s inventory recovery might average far above $2,009 if the stock includes high-value industrial equipment, while a commodity supplier’s recovery might fall well below it. The page does not disclose these product specifics, so the per-item average should be understood only as a summary of the visible aggregate, not as predictive of what any particular surplus inventory will recover.
Why Surplus Valuation Requires Market Evidence
Current market data, industry trends, and comparable asset sales influence what surplus industrial equipment recovers. Surplus Network says its AI-powered fair-market-value assessments use these inputs, drawing on market data and similar transactions. However, the platform’s Terms of Use explicitly note that assessments are estimates and do not guarantee any specific sale price.
Beyond valuation, the choice between selling paths affects recovery. Surplus Network describes two main approaches: bulk purchase, which prioritizes a single transaction and faster recovery of capital and warehouse space, and continuous liquidation, which extends the selling window in pursuit of buyers and potentially higher realized prices over time.
Neither approach is universally optimal. A business with urgent capital needs and high storage costs may prioritize bulk sale despite accepting a lower percentage recovery. A business with patient capital and valuable but specialized equipment might pursue continuous liquidation to capture broader buyer interest.
Independent cross-industry data provide context on why idle inventory costs matter. The American Productivity and Quality Center benchmarks inventory carrying costs across a 1,024-company sample at a median of $19 per $1,000 of inventory revenue [APQC, Measure 100788, Inventory Carrying Cost per $1,000 Revenue, 2026].
That benchmark includes capital tied up, storage, insurance, taxes, handling and administration, shrinkage, and obsolescence. For a business with significant idle inventory, the urgency of liquidation depends on how these carrying costs stack against the time required to pursue higher recovery percentages.
Methodology and Limitations
The headline figure of 12,151 products totaling more than $24.4 million [Surplus Network, Energy & Utilities, October 2026] comes from an analyst sum of the 10 brand rows currently displayed on Surplus Network’s Energy & Utilities page. The page shows the latest valuation timestamps of September 10, 2026. The displayed dollar values are written as “over” specified amounts, meaning the sum is a lower bound, not an exact total.
This analysis does not establish a market-wide resale-value percentage for industrial MRO equipment. The visible rows cannot be treated as a representative sample of all surplus inventory, and the brand-level variation cannot be attributed to brand name alone without controlling for product type, model, condition, quantity, age, location, and current demand. The page reports these figures for informational transparency, but Surplus Network’s Terms of Use state that valuations are estimates and that the platform does not itself facilitate the sale, purchase, or payment transaction [Surplus Network, Terms of Use].
Frequently Asked Questions
What determines the resale value of surplus industrial inventory?
Market value depends on product and model specifications, condition, quantity available, age, obsolescence risk, current demand, comparable sales in the market, location and logistics, and timing of the sale.
Surplus Network’s AI-powered valuation uses market data, industry trends, and comparable asset sales as inputs. Better data about an asset’s specifications and condition generally allows a more meaningful market comparison, though Surplus Network’s Terms of Use emphasize that valuations are estimates and do not guarantee a specific sale price.
Why can two surplus inventories with similar item counts have very different liquidated values?
Item count alone does not reveal the actual product mix, condition, model distribution, age, market demand, or original value tier. Without knowing product specifics, condition, and market demand, similar item counts can yield vastly different liquidation values.
When might a bulk sale make more sense than continuous liquidation?
Bulk purchases are a faster path to capital and space recovery, while continuous liquidation extends the selling window over time. A bulk sale prioritizes simplicity and speed at the cost of potentially lower per-item recovery. Continuous liquidation pursues higher realized prices but requires longer warehouse commitment and internal workload to manage phased sales. The best choice depends on a company’s urgency, storage costs, the quality and specificity of the assets, current demand, and the commercial terms each approach offers. Neither is universally superior.
Are AI-powered fair-market-value estimates guaranteed sale prices?
Surplus Network’s Terms of Use explicitly state that AI-powered fair-market-value assessments are estimates and do not guarantee a specific sale price. Valuations provide a starting point for understanding market context, but actual realized prices depend on buyer interest, negotiation, condition verification, and market conditions at the time of sale.
What information should a company prepare before valuing surplus MRO inventory?
Surplus Network recommends gathering product specifications and model information, exact quantities per SKU, assessment of condition (new, refurbished, used, obsolete), and any other relevant details about the inventory. Better documentation allows for more meaningful market comparison and more actionable valuation insights.
About Surplus Network
Surplus Network, founded in 2010 and based in Toronto, Ontario, helps businesses evaluate and recover value from excess or obsolete industrial inventory. The company provides AI-powered fair-market-value estimates, connections with qualified buyers, and two main selling options: bulk purchase for faster recovery and continuous liquidation for extended selling windows.
Source: Surplus Network
Contact: Aaron Lee
Email: hello@surplus.net
Location: Toronto, Ontario
https://www.surplus.net
SOURCE: Surplus Network
View the original press release on ACCESS Newswire